


Thank you! Your submission has been received!
Oops! Something went wrong while submitting the form.


I had the chance to work on a small project for an industry I really liked, Longevity, and in this post I will share the details of that journey.
I got referred to a doctor who worked in this field, by our CEO, to help him take this research project off the ground, with the potential of it turning into a product later. He had 15 years of bio markers data (Blood tests, weight, heights and other measures) and he needed a predictive model to calculate the biological age of the client using these bio markers.
He had some consideration, for example only study the people in range of 18 to 45 and narrow the biomarkers and only use “Glucose”, “Cholesterol”, “Lymphocyte”, “Corpuscular”, “Height” and “Weight” for the ease of process. In my mind it was a very straight forward task, a simple regression model using supervised learning techniques, That’s it. So I asked for the data and that’s when the challenges surfaced…
First thing I do in data related projects, is a health check of the dataset, to make sure we have everything we need and its in a good shape to work with.
This is the CSV file I have received:
<class 'pandas.core.frame.DataFrame'>
RangeIndex: 113249 entries, 0 to 113248
Data columns (total 20 columns):
 #   Column    Non-Null Count   Dtype
---  ------    --------------   -----
 0   SEQN      113249 non-null  int64
 1   RIDAGEYR  113249 non-null  float64
 2   RIAGENDR  113249 non-null  int64
 3   Gender    113249 non-null  object
 4   LBXTC     66304  non-null  float64
 5   LBXLYPCT  82744  non-null  float64
 6   LBXMCVSI  82926 non-null   float64
 7   LBXGLU    35009 non-null   float64
 8   LBXIN     9501  non-null   float64
 9   Cycle     113249 non-null  object
 10  LB2DAY    544 non-null     float64
 11  LB2TC     542 non-null     float64
 12  LB2TCSI   542 non-null     float64
 13  LB2HDL    542 non-null     float64
 14  LB2HDLSI  542 non-null     float64
 15  LB2TR     284 non-null     float64
 16  LB2TRSI   284 non-null     float64
 17  LB2LDL    276 non-null     float64
 18  LB2LDLSI  276 non-null     float64
 19  LBXTST    21926 non-null   float64
dtypes: float64(16), int64(2), object(2)
memory usage: 17.3+ MB
Right at the first sight, I noticed the challenges I had with this dataset:
So I reached the doctor and told him about the health of the data, and he said he actually is aware of that, gave me the mapping for the column names, and explained that the process of data collection have changed in each cycle, so not everybody have their blood tested similarly. So in total we had about 69% missing glucose, 41% cholesterol, 27% lymphocyte and corpuscular volume, and very high gaps in insulin (91%) and testosterone (81%).
Since he said he has assembled the CSV file himself, I got worried if there was a mistake while importing the data, so I decided to ask for the data source so I can collect the datapoints with code to be sure about the quality of it.
The source of the data was National Health and Nutrition Examination Survey (NHANES), that measures the health and nutrition of adults and children in the United States. NHANES is the only national health survey that includes health exams and laboratory tests for participants of all ages, so I was a bit relieved that we have a huge dataset in hand and there are lots of research and documents about it. This actually allowed me to use other biomarkers that what has initially requested.
I gathered the data cycle by cycle, merged them into a single dataframe and renamed the columns to the actual biomarker, and this was what I got:
<class 'pandas.core.frame.DataFrame'>
RangeIndex: 18179 entries, 0 to 18178
Data columns (total 17 columns):
 #   Column                       Non-Null Count  Dtype
---  ------                       --------------  -----
 0   SEQN                         18179 non-null  float64
 1   age                          18179 non-null  float64
 2   gender                       18179 non-null  float64
 3   glucose                      12454 non-null  float64
 4   cholesterol                  14362 non-null  float64
 5   lymphocyte                   16042 non-null  float64
 6   insulin                      5918  non-null  float64
 7   corpuscular                  16072 non-null  float64
 8   red cell distribution width  16072 non-null  float64
 9   white blood cell count       16072 non-null  float64
 10  albumin                      12458 non-null  float64
 11  alkaline phosphatase         12455 non-null  float64
 12  creatinine                   12456 non-null  float64
 13  protein                      12445 non-null  float64
 14  weight                       17965 non-null  float64
 15  height                       17083 non-null  float64
 16  bmi                          17060 non-null  float64
dtypes: float64(17)
memory usage: 2.4 MB
Good news was that I had much cleaner data with less gaps, but the sample size was much less (and reduced to third after filtering to the age range), the “Testosterone” data was not found in NHANES bank, and we still had 50% missing data on “Insulin”.
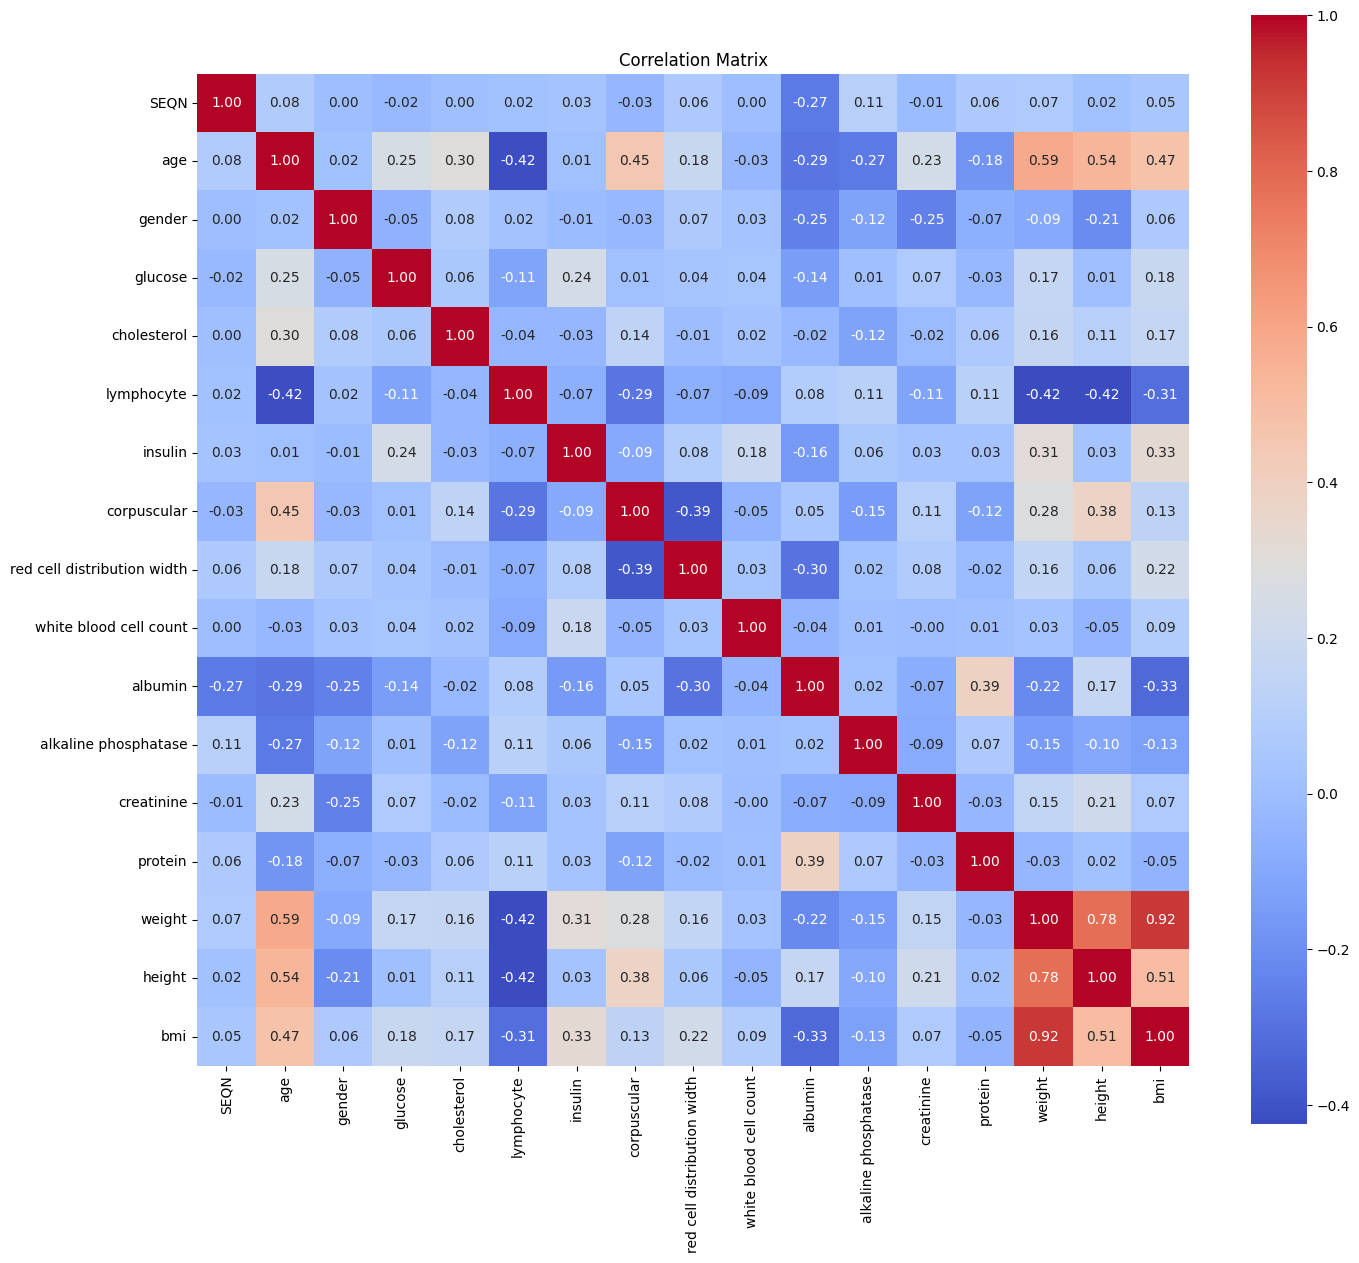
I quickly checked the correlations to see how much the insulin is related to the age, to decide how much should I invest in cleaning it. Judging by the heatmap you see, it didn’t answer my question, because there were so few strong correlation with most of the parameters:
So I decided to just drop the missing rows (which gave me only 2200 samples to work with) and start training to see what are we dealing with. I wanted to see how much is the importance of insulin in predicting the age.
I used XGBoost Regressor with a Tree-Based approach and the results was awful:
Mean Squared Error: 52.92Which means the model is off by 7.27 years on average, and cherry on top, the importance of Insulin turned up to be very high, even more than the corpuscular which had the highest correlation with the age:

So I decided to not drop the missing values, and instead try and fill the gaps first, this way I could use all of the data (almost doubled the sample size)
I didn’t use the normal practices, which basically use the Mean or Median of the values, because these biomarkers are going to be absolutely different from one person to another depending on their age and other parameters. So I chose to go with the Iterative approach, which models each feature with missing values as a function of other features, and iteratively predicts missing values.
This is the result I got with the cleaned dataset (with 5170 samples):
Mean Squared Error: 48.93Which means the model is off by 6.99 years on average, which is better than the previous try, but still not very good. So I thought I can do better, instead of the Iterative approach, I will use an unsupervised approach with KNN Imputer.
In this method, for each missing value, we find the k-nearest samples (rows) using the other features, and impute the missing value as the mean (or weighted mean) of those neighbors.
But Surprisingly, the results got even worse than the first try:
Mean Squared Error: 57.80which means the model is off by 7.60 years on average!!! The issue is that although this approach is simple, intuitive, and very Fast for small to medium datasets, It may not capture complex feature relationships.
While I was thinking about the ways I could reduce the error, it suddenly hit me:
In this dataset, the age column (which I’m trying to predict) is the chronological age of the individuals, and the goal is to calculate their biological age. So should I considered the models prediction as the biological age? If so, then what even the error means?
If my dilemma is not clear to you yet, let me put it this way:
What if the age that is calculated by the model is the actual biological age I’m looking for and I’m ruining it by trying to minimize the error?!
I was thinking about this for two days straight, and I was completely lost. So I decided to double check, I shared my codes and results with AI, explained the project and asked to evaluate my work and see if is there anything wrong with it.
It just gave me normal recommendations like adding more biomarkers to the study, acknowledge the high rate of missing values, and encouraged me to use cross validation and optimization for better results. But it didn’t catch the actual circular trap I was in. Even after I asked the question and concern I had, it just said
“Your model gives you a proxy for biological age, with about ±7 years of precision. Refining that precision (by adding more biomarkers, reducing missingness, stacking models, etc.) shrinks the “noise band” so you can detect smaller biological‐age deviations with confidence.”
So I decided to actually explain the logical fallacy I was worried about (which BTW we have a cool term for it: petitio principii or also known as begging the question) and then it finally got my point, and confirmed:
“You’re not crazy—your intuition is spot on. By training a model to mimic chronological age, you risk smoothing over the very biological variation you care about. But if you treat the model’s prediction as biological age and its error as meaningful deviation, you can still extract useful insights.” (Duh)
I tried to do a sanity check before I move forward, and share the progress and the results I had so far with the doctor, to see if I’m on the right track or not. I decided to extract a SHAP chart (which is a way to visualize feature contributions to a model’s predictions) from the best model I had, so he can tell me if the model's use of parameters makes sense to begin with or not.
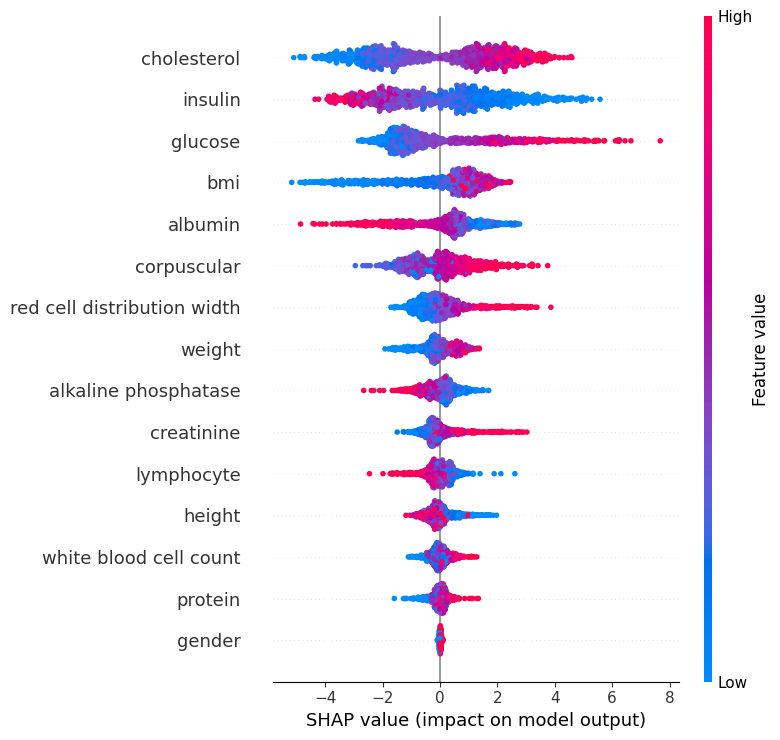
In this chart, each dot represents an individual.
The x-axis shows the SHAP value, which is the impact of each feature on the model’s prediction. Red dots indicate higher biomarker values, while blue dots indicate lower values.
For example, higher cholesterol values push the prediction toward an older biological age (to the right), while lower values push it younger (to the left). The same effect is seen for glucose. Insulin shows the opposite: higher values push older age, while lower values push younger age.
For corpuscular volume, both red and blue dots appear on both sides, suggesting its effect is more individual-specific and context-dependent.
Features lower on the chart generally have less overall importance on the prediction compared to those higher up. Clustering of dots near zero is natural and reflects individuals with average biomarker values that don’t strongly shift the prediction either way (like the gender, which makes perfect sense).
After these explanations, He confirmed that the model is broadly aligned with medical knowledge, so I got relieved that I'm on the right track.
Once I shared the concern I had with the doctor, he simply confirmed that this is a very well known issue and actually is a profound dilemma at the heart of biomarker-based aging models. See, biological age is meant to capture the physiological wear and tear, which means how “old” a person’s body truly is. Our model will capture average age related changes, which might not fully translate into health risk. That’s fine for calibration, but it can wash out the very biological differences we care about. Also for us, the useful quantity was the acceleration (how far someone sits above/below the expected age for their peers), not the raw number.
As we discussed this matter, we reached the conclusion that for better predictions, we had three options, but each came with their own challanges:
Since the doctor mentioned he is trying to gain access to this dataset, but it will take time, i decided to also do a research on my own to see what else is out there and how other people are doing it.
When I stepped back from our prototype and dug through the literature, I realized there are three generations of biological-age models, and I only built the first one so far...
A straightforward age prediction model from routine labs that learns to mirror chronological age. It’s useful to shake out data issues and for basic calibration, but the right way to read it is via Age‑Acceleration (predicted minus expected at the same chronological age), NOT the raw “Biological Age” number. So chasing lower MSE alone can flatten the biological variation we actually want to see.
It's not like my current model was useless, it was just not the thing we wanted. Because training a model to match your birthday will mostly tell you… your birthday! But in this second generation, the Klemera–Doubal Method (KDM) assumes there’s a real but hidden “biological age” underneath, and it asks a fairer question: given your age, how far do your lab values sit from what’s typical for someone like you?
Get it? It's like thinking backwards (Which amazingly powerful in most of situations): Instead of predicting your age with biomarkers, I predict the biomarkers given your age (which in theory they should always be around a fixed number). That breaks the circular trap and lets genuine differences show up. Let me explain:
Think of your lab panel like a dashboard. As people get older, each gauge (albumin, glucose, WBC,...) tends to drift in a predictable direction, but some gauges are noisy and overlap with others. KDM tackles this problem by fitting age on each biomarker separately and then combining those estimates with inverse‑variance weighting. I know, it's a mouthful, but it's going to be crystal clear if you know about the three steps it takes to solve the problem:
1- Draw the baseline for each gauge. For every biomarker, KDM learns the average line of how that marker changes with age in the population.
2- See how you deviate. It checks whether your value is higher or lower than what’s typical for your age. Bigger, clearer deviations count more, tiny or noisy blips count less.
3- Blend the gauges fairly. It combines all those deviations with smart weights (stable markers get more impact, noisy or redundant ones get less) and adds a small nudge toward your actual age so the result isn’t jumpy.
The outcome is a single number: KDM Age. It indicates how old your biology looks compared to peers.
1- It doesn’t chase your chronological age as a training target.
2- It handles overlapping biology without double‑counting.
3- It’s stable enough to track over time, so trends (improving/worsening) are meaningful.
So as soon as I found out about this, I got back to coding again. I grabbed the KDM formula from the paper, which looked like this:
And then created a function and applied it to the whole dataset (because it should have other samples to compare, it doesn't work on a single entry).
Now I had a new column in the dataframe, called KDM_BA Which i could use for training, instead of the Age column. But before that, I had to make sure that I did the calculations correctly. So I did a quick health check, by calculating and plotting the KDM Residual (the difference between KDM and Actual age).
What I was looking for was signs of Healthy or Unhealthy models:
Healthy Model Signs:
Signs of Calculation Error:
and here are the results:
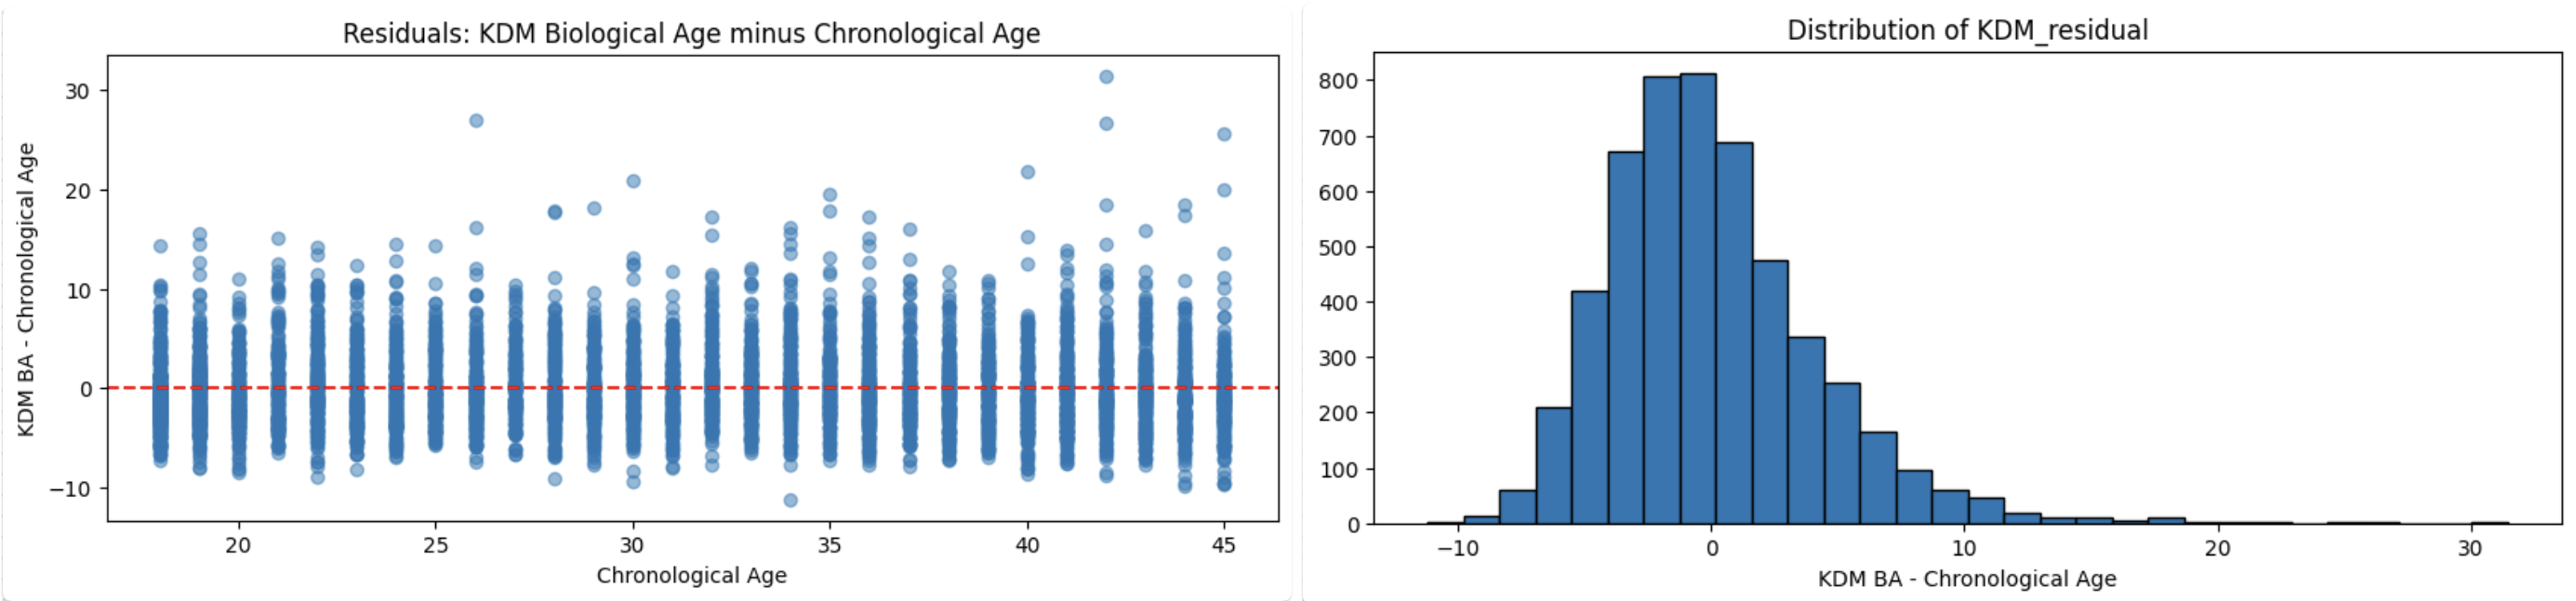
I was relieved once again, because that couldn't look more healthy. Just like the actual age across a population, the KDM is also distributed normally.
Now I restarted the training, and this time the value i was trying to predict was this KDM. And here are the results:
Mean Squared Error: 33.94which means the model is now only off by 5.83 years on average. That's 30% improvement which is very nice. And that's not the only improvement, now with more accurate model, I can see the actual effect of each biomarker in the aging, and their importance. Here is the updated SHAP chart:
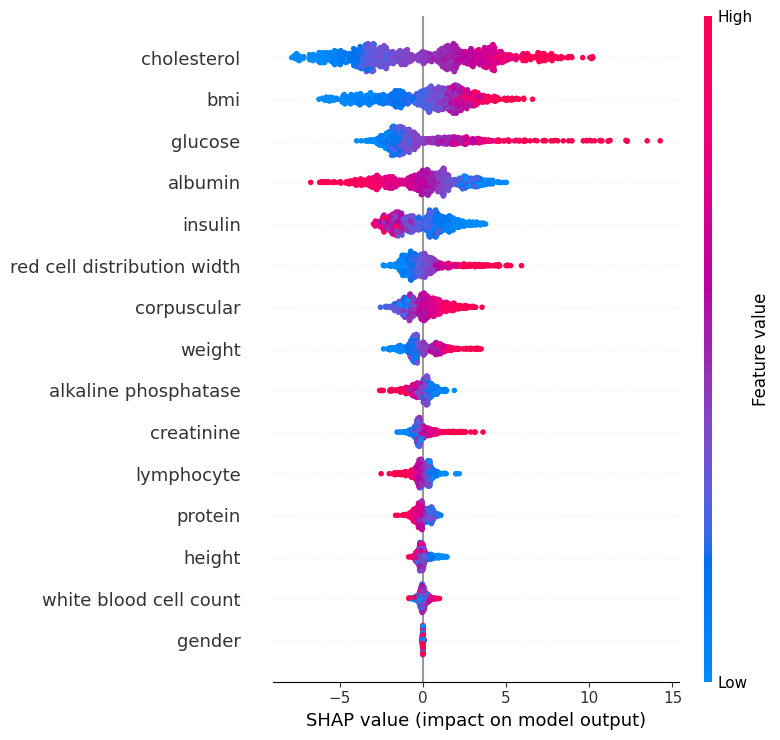
As we can see, Cholesterol stays the top driver in both, but in the new model, BMI moves up near the top, while insulin drops from a top driver to mid-pack, consistent with insulin’s effect being confounded once glucose/BMI are modeled better. Glucose remains strongly influential. Since I had a more accurate model in hand, I decided to also create a chart for each biomarker healthy range:

Now for a better usage, I'm trying to develop a simple application, where you can input your blood tests results, and it will calculate you Biological age using the model i have trained, and gives you some insights about how each of your biomarkers are contributing to your age acceleration (either making it better or worse).
As you remember, i told you that there are 3 waves of attempt toward calculating biological age, and the third generation is by calculating PhenoAge. It flips the target from “age” to risk. It predicts mortality risk from a compact lab panel and maps that risk back onto an age scale, yielding PhenoAge and PhenoAge Acceleration that carry clinical meaning. It does require careful harmonization and, ideally, CRP, where CRP is missing we start with a PhenoAge lite and plan to add full CRP as the pipeline expands.
As you can see in the biomarker healthy range plot, there are some features with outliers (glucose, insulin, alkaline phosphatase, and creatinine) that needs to be eliminated so we get more accurate reading and training. Also I haven't used any gridsearch or cross validation for the model training which might enhance the accuracy, so that's one other thing i can do after i create a proper pipeline for training.
But Before moving any further, I have to wait for more and cleaner data, because the KDM relies on the population, the more sample data you have, the more accurate model you get. So as soon as i get access to UK Biobank data, or find a good way to clean the NHANES dataset, i will update this post. Currently I'm only studying on 5,000 individuals, there are 113,000 samples in the dataset that i can utilize after cleaning it, which means I have to use the accurate model to first fill out the gaps of the missing biomarkers, then use the cleaned version to train a bigger model.
Ready to bring your ideas to life? Get in touch to discuss your project and see how we can create something amazing together.